Tools for Improving Site Performance
Use Firebug or a similar tool to view the loading operations of a page and determine how long the page takes to load. Use this tool to improve performance by identifying what is causing a page to be slow.
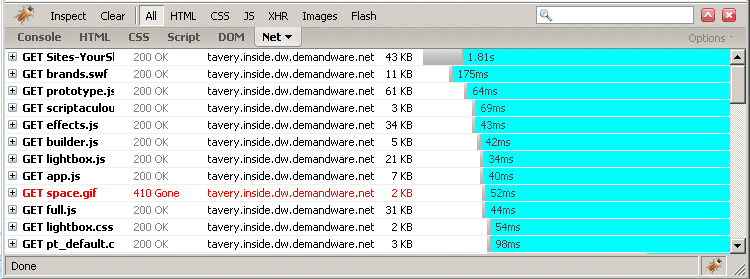
In Firebug, from the main menu , select All and then Net.
The following example shows the loading times for the home page of the Reference Application.

Firebug is exclusively used for performance testing in Firefox. For other browsers, use different tools.
There are several Firefox Add-ons recommended for assessing and improving front-end performance:
- Firebug - use to debug CSS, HTML, and JavaScript live in web pages.
- Hammerhead - use to measure the load time of web pages.
- Web Developer Toolbar - a series of web developer tools
- Fiddler - use as an HTTP Debugging Proxy to log HTTP traffic.
- YSlow! - use to analyze web pages to determine performance improvements.
- TamperData - use to view and modify HTTP or HTTPS headers and POST parameters.
- WebPagetest - a helpful performance testing tool that details specific changes to caching and image compression, along with other metrics.
You can also use Code Profiler, which is included with Salesforce B2C Commerce, to assess your storefront performance.